![Sales Volume [Number of Property Transactions]](https://www.housepricecrash.co.uk/wp-content/uploads/2023/10/Sales-Volume-Number-of-Property-Transactions-17.png)
Period Covered |
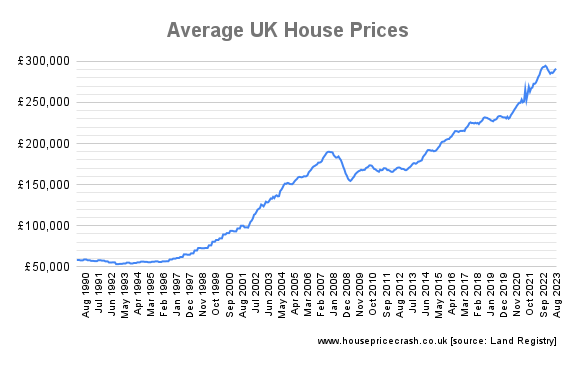
Average House Price |
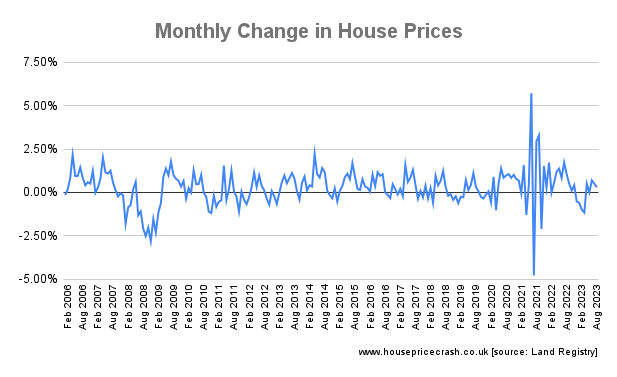
Monthly Change (%) |
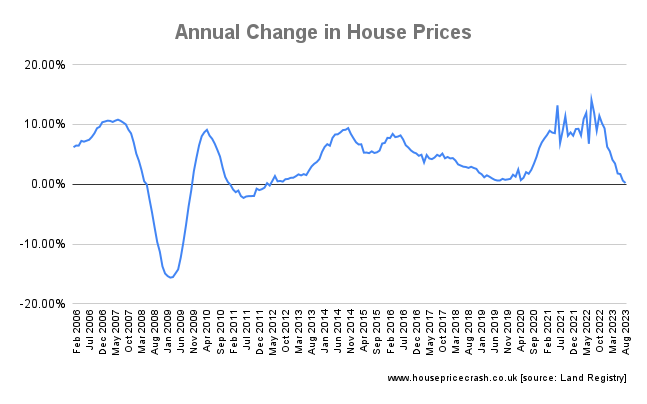
Annual Change (%) |
Volume of Sales |
Official Releases |
|---|---|---|---|---|---|
| Aug 23 | £291,044 | not yet released | Latest Report | ||
| Jul 23 | £289,824 | not yet released | Latest Report | ||
| Jun 23 | £287,546 | 52,252 | - | ||
| May 23 | £285,861 | 43,264 | - | ||
| Apr 23 | £286,489 | 39,580 | - | ||
| Mar 23 | £285,009 | 51,597 | - | ||
| Feb 23 | £287,506 | 44,636 | - | ||
| Jan 23 | £289,819 | 45,257 | - | ||
| Dec 22 | £294,329 | 61,062 | - | ||
| Nov 22 | £294,910 | 66,781 | - | ||
| Oct 22 | £296,422 | 66,319 | - | ||
| Sept 22 | £294,559 | 68,703 | - | ||
| Aug 22 | £294,598 | 69,184 | - | ||
| Jul 22 | £292,118 | 66,344 | - | ||
| Jun 22 | £286,397 | 53,975 | - | ||
| May 22 | £283,496 | 52,562 | - | ||
| Apr 22 | £281,161 | 52,070 | - | ||
| Mar 22 | £278,436 | 57,103 | - | ||
| Feb 22 | £276,755 | 55,182 | - | ||
| Jan 22 | £273,762 | 41,416 | - | ||
| Dec 21 | £274,712 | 46,806 | - | ||
| Nov 21 | £270,708 | 45,800 | - | ||
| Oct 21 | £268,349 | 37,412 | - | ||
| Sept 21 | £269,945 | 54,279 | - | ||
| Aug 21 | £264,244 | 40,527 | - | ||
| July 21 | £255,535 | 28,400 | - | ||
| June 21 | £265,668 | 56,362 | - | ||
| May 21 | £254,624 | 39,080 | - | ||
| Apr 21 | £250,772 | 51,623 | - | ||
| Mar 21 | £256,405 | 97,984 | - | ||
| Feb 21 | £250,341 | 77,149 | - | ||
| Jan 21 | £250,397 | 70,145 | - | ||
| Dec 20 | £249,578 | 88,501 | - | ||
| Nov 20 | £247,832 | 86,231 | - | ||
| Oct 20 | £244,941 | 90,365 | - | ||
| Sep 20 | £241,925 | 73,553 | - | ||
| Aug 20 | £239,007 | 64,101 | - | ||
| Jul 20 | £236,609 | 60,946 | - | ||
| Jun 20 | £234,874 | 51,601 | - | ||
| May 20 | £231,071 | 35,380 | - | ||
| Apr 20 | £230,296 | 27,825 | - | ||
| Mar 20 | £232,943 | 68,792 | - | ||
| Feb 20 | £230,609 | 67,437 | - | ||
| Jan 20 | £231,940 | 68,559 | - | ||
| Dec 19 | £231,792 | 84,958 | - | ||
| Nov 19 | £232,096 | 93,439 | - | ||
| Oct 19 | £232,919 | 90,625 | - | ||
| Sep 19 | £233,536 | 84,025 | - | ||
| Aug 19 | £233,366 | 95,774 | - | ||
| Jul 19 | £232,618 | 89,176 | - | ||
| Jun 19 | £230,049 | 84,287 | - | ||
| May 19 | £229,061 | 82,426 | - | ||
| Apr 19 | £228,749 | 73,561 | - | ||
| Mar 19 | £227,104 | 78,955 | - | ||
| Feb 19 | £227,738 | 67,756 | - | ||
| Jan 19 | £228,314 | 65,597 | - | ||
| Dec 18 | £230,776 | 61,424 | - | ||
| Nov 18 | £230,630 | 71,849 | - | ||
| Oct 18 | £231,095 | 66,599 | - | ||
| Sept 18 | £232,554 | 59,691 | - | ||
| Aug 18 | £232,797 | 73,713 | - | ||
| Jul 18 | £231,422 | 63,774 | - | ||
| Jun 18 | £228,384 | 63,673 | - | ||
| May 18 | £226,351 | 58,073 | - | Apr 18 | £226,906 | 50,308 | - |
| Mar 18 | £224,144 | 58,203 | - | ||
| Feb 18 | £225,047 | 51,340 | - | ||
| Jan 18 | £225,621 | 50,583 | - | ||
| Dec 17 | £225,330 | 91,613 | - | ||
| Nov 17 | £224,453 | 92,234 | - | ||
| Oct 17 | £225,092 | 92,827 | - | ||
| Sep 17 | £224,895 | 94,287 | - | ||
| Aug 17 | £225,738 | 98,938 | - | ||
| Jul 17 | £224,719 | 92,257 | - | ||
| Jun 17 | £221,833 | 101,940 | - | ||
| May 17 | £219,954 | 83,671 | - | ||
| Apr 17 | £218,642 | 75,980 | - | ||
| Mar 17 | £215,236 | 89,388 | - | ||
| Feb 17 | £215,697 | 71,432 | - | ||
| Jan 17 | £215,243 | 68,663 | - | ||
| Dec 16 | £215,500 | 94,685 | - | ||
| Nov 16 | £215,113 | 88,926 | - | ||
| Oct 16 | £214,107 | 85,296 | - | ||
| Sep 16 | £214,816 | 91,720 | - | ||
| Aug 16 | £215,145 | 94,407 | - | ||
| Jul 16 | £215,127 | 93,197 | - | ||
| Jun 16 | £212,887 | 88,475 | - | ||
| May 16 | £210,872 | 72,174 | - | ||
| Apr 16 | £208,443 | 63,854 | - | ||
| Mar 16 | £207,667 | 138,124 | - | ||
| Feb 16 | £205,555 | 75,907 | - | ||
| Jan 16 | £205,464 | 70,959 | - | ||
| Dec 15 | £204,920 | 94,397 | - | ||
| Nov 15 | £204,223 | 93,854 | - | ||
| Oct 15 | £202,664 | 104,451 | - | ||
| Sep 15 | £202,389 | 94,554 | - | ||
| Aug 15 | £201,973 | 96,533 | - | ||
| Jul 15 | £200,142 | 106,216 | - | ||
| Jun 15 | £189,802 | 96,979 | - | ||
| May 15 | £195,313 | 86,144 | - | ||
| Apr 15 | £193,225 | 75,240 | - | Mar 15 | £191,537 | 77,669 | - |
| Feb 15 | £190,827 | 67,070 | - | Jan 15 | £190,665 | 66,819 | - |
| Dec 14 | £177,328 | 70,470 | - | ||
| Nov 14 | £176,832 | 69,668 | - | ||
| Oct 14 | £176,865 | 84,340 | - | ||
| Sep 14 | £177,441 | 77,735 | - | ||
| Aug 14 | £177,462 | 87,173 | - | ||
| Jul 14 | £175,943 | 84,229 | - | ||
| Jun 14 | £172,011 | 80,435 | - | ||
| May 14 | £172,035 | 77,269 | - | ||
| Apr 14 | £172,069 | 66,659 | - | ||
| Mar 14 | £169,124 | 63,587 | - | ||
| Feb 14 | £170,000 | 62,368 | - | ||
| Jan 14 | £168,356 | 63,123 | - | ||
| Dec 13 | £167,353 | 75,182 | - | ||
| Nov 13 | £165,411 | 78,358 | - | ||
| Oct 13 | £165,515 | 71,929 | - | ||
| Sep 13 | £167,063 | 65,378 | - | ||
| Aug 13 | £164,654 | 74,767 | - | ||
| Jul 13 | £164,098 | 69,140 | - | ||
| Jun 13 | £162,621 | 60,168 | - | ||
| May 13 | £161,969 | 62,651 | - | ||
| Apr 13 | £161,458 | 48,367 | - | ||
| Mar 13 | £161,793 | 52,090 | - | ||
| Feb 13 | £162,606 | 43,573 | - | ||
| Jan 13 | £162,441 | 41,763 | - | ||
| Dec 12 | £162,080 | 53,860 | - | ||
| Nov 12 | £161,490 | 61,091 | - | ||
| Oct 12 | £161,605 | 56,337 | - | ||
| Sep 12 | £162,561 | 50,517 | - | ||
| Aug 12 | £163,376 | 62,291 | - | ||
| Jul 12 | £162,900 | 56,509 | - | ||
| Jun 12 | £161,777 | 56,077 | - | ||
| May 12 | £161,677 | 50,083 | - | ||
| Apr 12 | £160,417 | 41,244 | - | ||
| Mar 12 | £160,372 | 58,609 | - | ||
| Feb 12 | £161,588 | 43,331 | - | ||
| Jan 12 | £161,545 | 42,511 | - | ||
| Dec 11 | £160,384 | 61,470 | - | ||
| Nov 11 | £160,780 | 57,967 | - | ||
| Oct 11 | £159,999 | 55,309 | - | ||
| Sep 11 | £162,109 | 61,031 | - | ||
| Aug 11 | £162,347 | 62,010 | - | ||
| Jul 11 | £163,049 | 59,919 | - | ||
| Jun 11 | £161,479 | 54,776 | - | ||
| May 11 | £161,823 | 46,870 | - | ||
| Apr 11 | £163,083 | 48,704 | - | ||
| Mar 11 | £160,996 | 44,803 | - | ||
| Feb 11 | £162,215 | 38,336 | - | ||
| Jan 11 | £163,177 | 36,425 | - | ||
| Dec 10 | £163,814 | 54,812 | - | ||
| Nov 10 | £164,773 | 54,012 | - | ||
| Oct 10 | £165,505 | 55,964 | - | ||
| Sep 10 | £166,769 | 55,068 | - | ||
| Aug 10 | £167,423 | 58,783 | - | ||
| Jul 10 | £166,798 | 64,411 | - | ||
| Jun 10 | £166,072 | 59,390 | - | ||
| May 10 | £165,314 | 49,412 | - | ||
| Apr 10 | £165,596 | 49,323 | - | ||
| Mar 10 | £164,288 | 48,577 | - | ||
| Feb 10 | £164,455 | 40,502 | - | ||
| Jan 10 | £165,088 | 34,171 | - | ||
| Dec 09 | £161,783 | 73,889 | - | ||
| Nov 09 | £161,554 | 55,715 | - | ||
| Oct 09 | £159,546 | 59,700 | - | ||
| Sep 09 | £158,377 | 53,482 | - | ||
| Aug 09 | £155,968 | 53,236 | - | ||
| Jul 09 | £155,885 | 57,579 | - | ||
| Jun 09 | £153,046 | 48,903 | - | ||
| May 09 | £152,497 | 42,699 | - | ||
| Apr 09 | £152,898 | 36,233 | - | ||
| Mar 09 | £152,895 | 33,161 | - | ||
| Feb 09 | £153,862 | 25,592 | - | ||
| Jan 09 | £156,753 | 24,770 | - | ||
| Dec 08 | £158,946 | 36,341 | - | ||
| Nov 08 | £161,883 | 33,404 | - | ||
| Oct 08 | £165,529 | 41,123 | - | ||
| Sep 08 | £168,814 | 38,508 | - | ||
| Aug 08 | £174,493 | 45,437 | - | ||
| Jul 08 | £178,364 | 49,784 | - | ||
| Jun 08 | £180,781 | 54,072 | - | ||
| May 08 | £183,266 | 61,038 | - | ||
| Apr 08 | £183,626 | 57,831 | - | ||
| Mar 08 | £184,798 | 53,080 | - | ||
| Feb 08 | £185,616 | 57,016 | - | ||
| Jan 08 | £186,045 | 53,221 | - | ||
| Dec 07 | £184,469 | 72,880 | - | ||
| Nov 07 | £186,009 | 90,581 | - | ||
| Oct 07 | £184,346 | 90,280 | - | ||
| Sep 07 | £183,896 | 87,013 | - | ||
| Aug 07 | £182,914 | 109,585 | - | ||
| Jul 07 | £181,460 | 101,582 | - | ||
| Jun 07 | £181,039 | 105,312 | - | ||
| May 07 | £180,594 | 94,807 | - | ||
| Apr 07 | £179,935 | 84,024 | - | ||
| Mar 07 | £178,423 | 92,336 | - | ||
| Feb 07 | £177,099 | 76,959 | - | ||
| Jan 07 | £174,827 | 77,674 | - | ||
| Dec 06 | £173,717 | 102,706 | - | ||
| Nov 06 | £172,006 | 97,266 | - | ||
| Oct 06 | £171,709 | 93,136 | - | ||
| Sep 06 | £169,569 | 116,822 | - | ||